Turning Operations Nomogram
Introduction
It is a truth universally acknowledged, that a maker in possession of space, must be in want of a lathe. I am, in fact, already in possession of a lathe, but have found it lacking in a way that had left me in search of a replacement. Having considered everything from digging some local iron out of some Detroit Metro suburban basement to flying to Japan and picking out some heavy iron to ship home.
In this search I found myself standing in an industrial liquidator’s warehouse staring at an unremarkable rather abused Bridgeport Romi toolroom lathe. While I would eventually decide that my current lathe should receive some well-deserved attention before deciding its fate, that Bridgeport Romi sent me down a rabbit hole.
Romi is a Brazilian manufacturer. I was unfamiliar with them and from some investigation I learned that they have, at different times, been imported into the United States by DoAll and Bridgeport. they aren’t the only Brazilian company making respectable lathes, Nardini does as well, and that they both put a convergence chart on the control panel of the headstock of their lathes for quickly finding feeds and speeds for turning operations. Romi even includes this chart on their CNC lathes. I have yet to see this elsewhere, or a similar convergence chart for cutting speeds and feeds, even in a reference book.
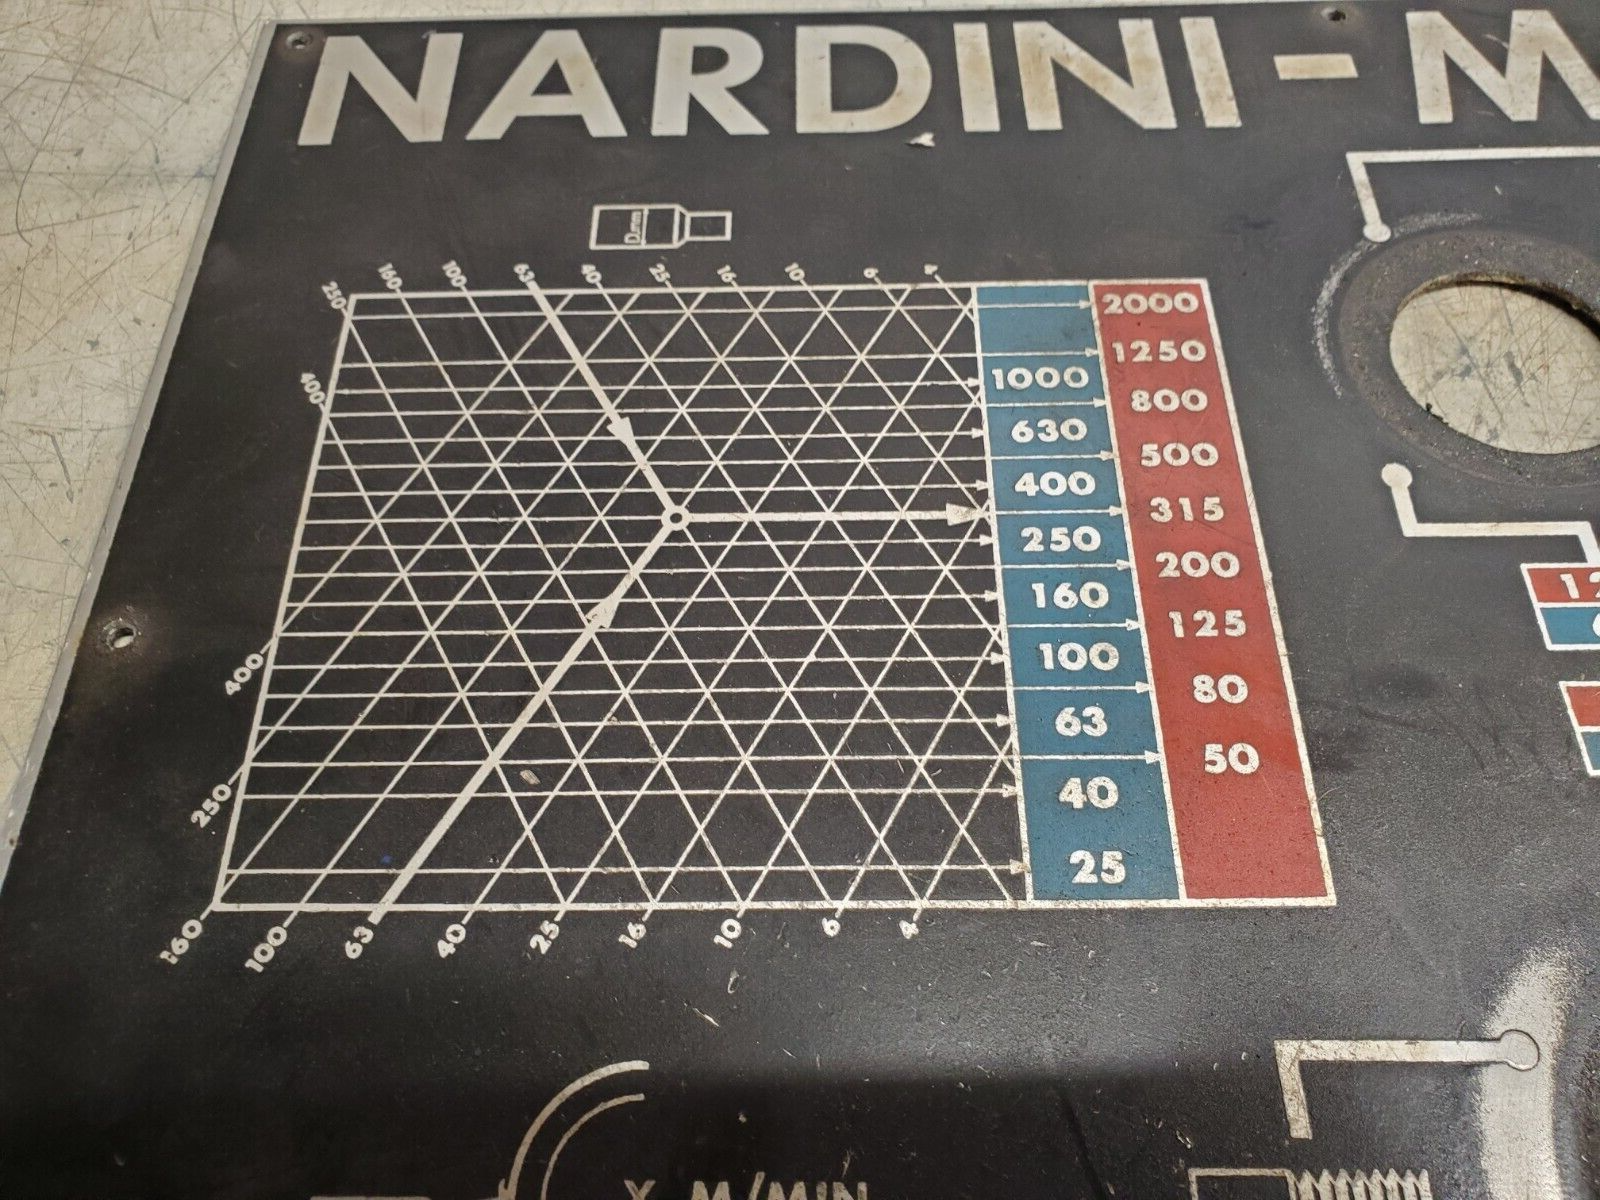
Below is a panel from a Nardini, as featured in an eBay ad, which prominently shows the convergence chart in question.
As I absolutely love all things nomogram, I decided I wanted to put something together for myself.
How does it work?
I’ll admit that it took me a minute to realize how this particular chart worked. At the top you select your cutting diameter. At the bottom you select your cutting feedrate. You follow these grid lines until they intersect and read your spindle speed off of the vertical axis.
Convergence Charts
Of course any investigation into nomograms will eventually land you on Prof. Chris Staeker’s page and YouTube video about Lalanne’s Abaque.
While the convergence chart above is very similar to the Abaque, it is much more similar to the hexagonal charts Ron Doerfler reports about on his blog “Dead Reckonings”.
Ron’s post shows a few other ways this particular information can be presented, mainly in an actually hexagon-shaped chart rather than the funky square chart on the lathe.
Our nomogram
Chris Staeker was kind enough to share the TeX file he authored to create his Abaque chart and his K+E graph sheets. I used these as the start of my turning feeds and speeds chart.
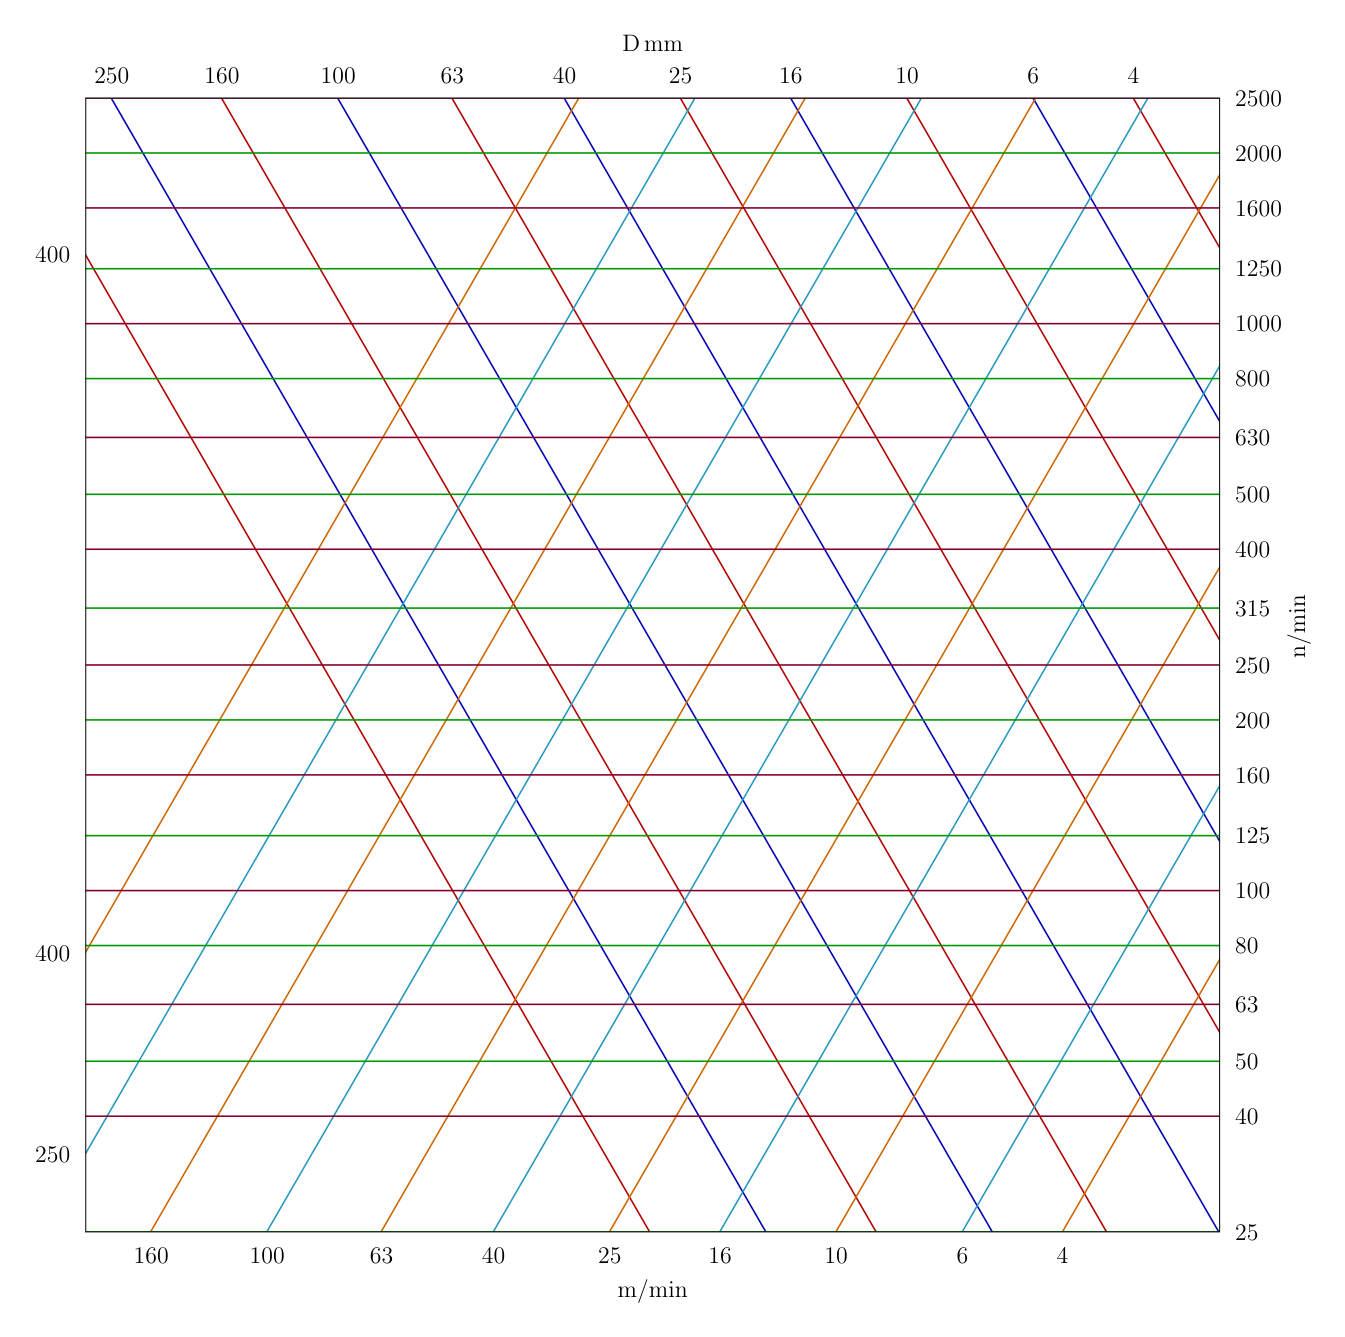
nomograms exploit the “everything is a straight line” of log-log plots, and the convergence chart in question is no exception. All three of our axes are log scales with grids on the Renard series. Since Renard’s preferred numbers follow a geometric progression, the grid lines follow a regular cadence across the chart. Nardini’s chart leaves off 1600 RPM on the their chart, presumably because the fixed speeds available does not include 1600 RPM. I decided to include it in mine.
Speeds and Feeds
The nomogram in question is a representation of the equation for turning equation.
m = π · D · n n = m / (π D)
where D = workpiece/cutter diameter [mm] m = cutting speed (surface speed) [m/min] n = rotational speed (RPM) [1/min]
In order to accomplish this the cutting diameter axis and feed rate axis must be shifted with respect to each other to achieve the correct relationship until 63 mm cutting diameter and 63 m/min align with 315 RPM as on the Nardini chart.
Closing
This is where I admit that I know very, very little about tex programming. I must apologize in admitting I made liberal use of Lumo and Kagi Assistant in producing this chart. In the process I learned about pyNomo.